Electrostatic Potential
Last update: 2022-05-17
Purpose
Excerpts from Kessel & Ben-Tal [1]:
(highlights in bold added for convenience here)
"The activity of a protein almost always depends on the protein’s ability to recognize and bind molecular elements in its vicinity. Therefore, scientists are often interested in properties of the protein surface, which is in contact with the surrounding environment. It is possible to calculate and represent the surface of a protein (Figure 2.4.4) by rolling a virtual water-size probe around the atomic contours of the protein[192, 193]. (Figure 2.4.5). Different types of surfaces can be calculated this way, such as the molecular surface and the water-accessible surface. The latter is particularly useful in enabling the scientist to identify parts of the protein that constitute potential binding or active sites. To identify these sites, the scientist would first look for depressions and crevices on the surface that look suitable for such a purpose. Identifying functional sites only by their geometry is difficult, and scientists therefore use data relating to additional properties of the protein regions in question. For example, many binding sites have electrostatic potential that is complementary to that of their ligands or substrates [125] (see Chapter 8 for details).
By calculating the potential and coloring the protein surface according to the calculated values (Figure 2.4.6), it may be possible to narrow the search for binding sites to specific regions in the protein."
...
"For example, some proteins use positively charged residues to associate electrostatically with the negatively charged DNA or negative side of the plasma membrane. It is difficult to find such regions using a simple representation of the protein. However, in an electrostatic potential map of the protein, such regions are easily spotted as distinct ‘clouds’ of positive potential. A powerful demonstration of the use of such representation to investigate structure-function relationships has been given by Murray and Honig."
Description
MIZTLI can visualize proteins' electrostatic surface potential. The electrostatic potential is computed by APBS on the MIZTLI server and the protein surface is colored accordingly.
PLEASE NOTE: APBS authors insist on registering to use their software to ensure continued support.
Procedure
Open a 3D View
From the Structure panel click on the name of a structure of interest. For example, for human protein PTEN, click on '7jul':
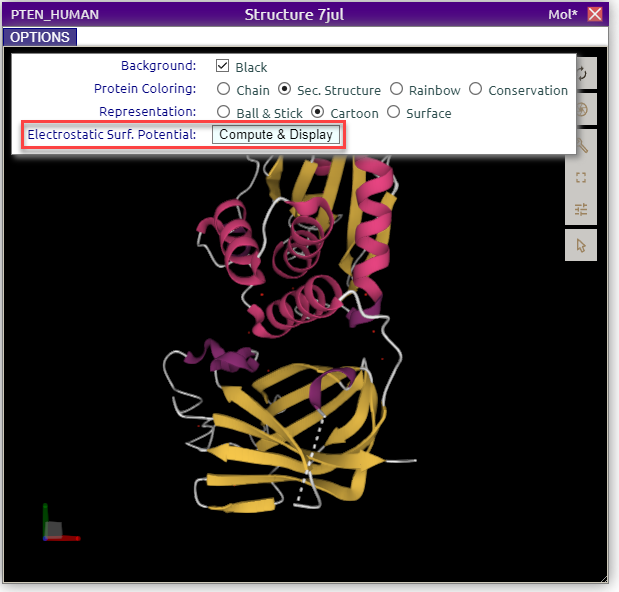
Calculate the electrostatic potential with APBS
In the Options sub-panel, click on the 'Compute & Display' button of the Electrostatic Surf. Potential field.
This can take time, so patiently wait while APBS computes the potential and MIZTLI downloads and displays the data...
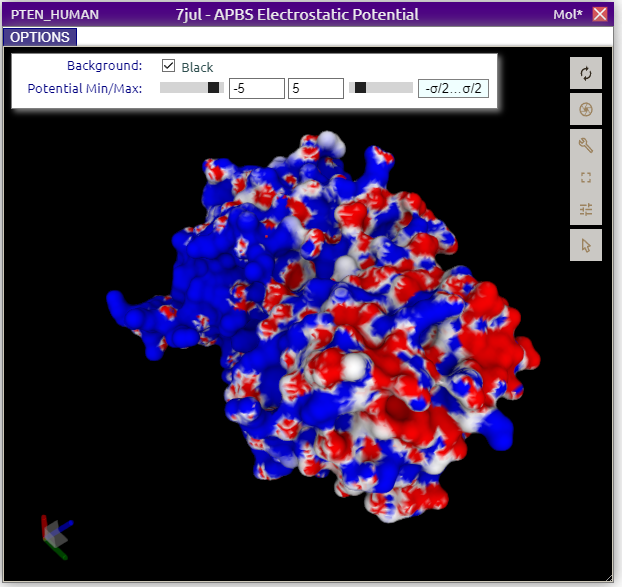
In this representation a red-white-blue color gradient is used. Negative potentials (𝜙 < 0 kT/e) are red, positive potentials are blue, and neutral potentials are white. Min and Max thresholds can be adjusted, where values < Min are plain red, and values > Max are plain blue.
References
[1] Amit Kessel and Nir Ben-Tal. Introduction to Proteins (2nd Edition). Taylor & Francis, 2018
[2] Murray, D. and B. Honig (2002). "Electrostatic control of the membrane targeting of C2 domains." Mol Cell 9(1): 145-154.